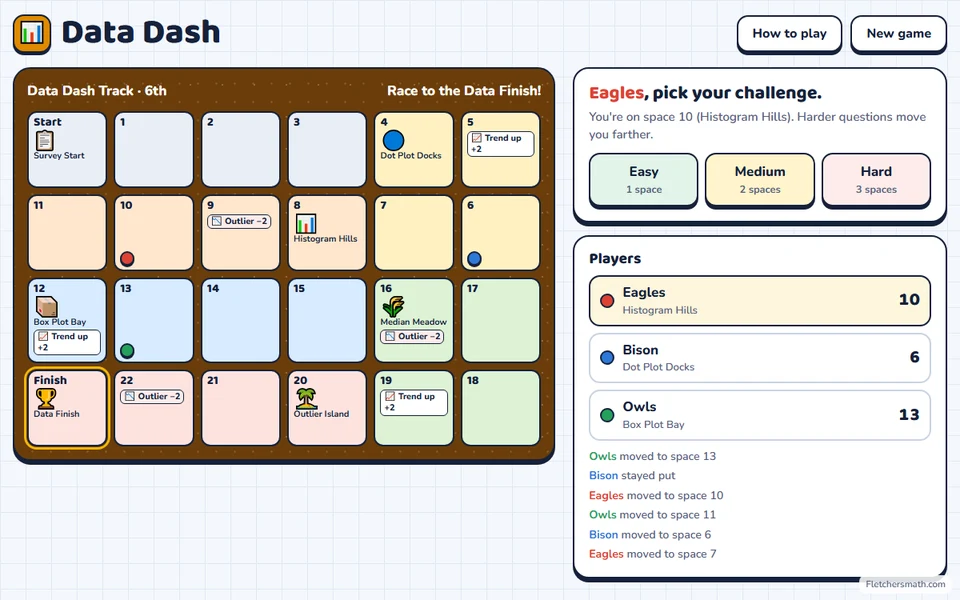
Data Dash
Race to the finish by asking statistical questions, finding mean, median, mode, range, IQR and MAD, and reading dot plots, histograms and box plots.
Try it free with your class: the demo runs right in your browser for 5 questions or 5 minutes, whichever comes first. No sign-up needed.
Or get every game, including all future games, with the All-Access Teacher License for $150.
What students practice
Statistical vs. non-statistical questions, mean, median and mode, finding a missing value from the mean, choosing the best measure of center, how outliers affect the mean and median, range, quartiles and IQR, mean absolute deviation (MAD), comparing consistency, reading dot plots and box plots, describing the shape of a distribution
Standards
OAS 6.D.1.1–2
Common Core: 6.SP.A.1–3 · 6.SP.B.4–5 · 6.SP.B.5c · 6.SP.B.5d · 6.SP.B.5a · 6.SP.B.5b
More games for these standards and topics
How it works
- Open the game file in any web browser: Chromebooks, laptops or your smartboard. No accounts, no student logins and no internet needed once it's downloaded.
- Enter the players or teams, then press Start.
- Students take turns on one shared screen, so the whole class can play together on a projector or smartboard.
- Each purchase includes the game file and a one-page Quick Start guide.